Advanced Geoprocessing
Introduction
By now, you have likely created a several geoprocessing models in ArcGIS. For most of you, these models were built expressly to complete an assignment. They may have not been pretty, or even all that robust, but they got the job done and perhaps even left a trail of what you did to arrive at your final product. As GIS becomes more a part of your life, however, and you are juggling multiple projects or are generating tools to be used by others in your team, you’re going to have to be a bit more organized and thoughtful about how you go about go about your work.
In this section, we re-examine geoprocessing models in ArcGIS. In particular, we establish some best practices for approaching a spatial analysis projects as well as dig deeper into many of the more interesting and powerful uses that ArcGIS Pro geoprocessing models are capable of.
Scenario/Materials
The basis for our exercise will be a simple analysis using historical hurricane tracking points available via NOAA’s International Best Track Archive for Climate Stewardship (IBTrACS). Instructions for obtaining these data are included in the exercises. Our analysis will consist of selecting points associated with a specific storm, deriving a storm track from these points, and selecting which US counties, if any, intersect its path.
Learning objectives
The set of exercises below will reveal a number of best practices associated with developing workflows in the ArcGIS Model Builder as well as some more advanced techniques you may have not learned in previous courses. By the end of these exercises, you should have competency with the following:
| Section | Learning Objectives |
|---|---|
| 1. Preparing for analysis | ♦ Create efficient and robust GIS workspaces ♦ Obtain, organize, & tidy data in preparation for analysis |
| 2. The analytical workflow & geoprocessing model | ♦ Construct effective geoprocessing workflows ♦ Create geoprocessing models from those workflows ♦ Tidy your geoprocessing models for clarity |
| 3. From workflow to tool: parameters, symbology & variables |
♦ Set model elements to be parameters ♦ Add variables to models & explain their utility ♦ Explain the importance of a variable’s data type ♦ Set model outputs to use specific symbology ♦ Convert models into geoprocessing tools |
| 4. Conditional processing in a geoprocessing model | ♦ Explain conditional execution in model workflows ♦ Control execution of processes using preconditions ♦ Include branching and merging in your workflows |
| 5. Looping and iteration in a geoprocessing model | ♦ Explain iteration in model workflows ♦ Describe the different iterators in ArcGIS Pro models ♦ Use a for loop to repeat a processing task |
| 6. User interactivity | ♦ Explain what makes feature set variables unique ♦ Enable user interactivity in your tool |
| 7. Documenting your tool | ♦ Add documentation to your geoprocessing tool |
| 8. Sharing your tool | ♦ Share your tool as a compressed zip-ball ♦ Explain what a geoprocessing package is ♦ Distribute model workflows via ArcGIS Online |
1. Preparing for analysis
1a. Creating a proper ArcGIS workspace
The first step in any geospatial project you begin should be to create a workspace that will keep your files organized. Geospatial analysis is notorious for making many, many intermediate datasets, themselves made up of multiple files, which can easily clutter up your machine. ArcGIS Pro has some mechanisms for handling this, but we recommend a few additional steps prior to creating your ArcGIS Pro project that will help in keeping your workspace organized. These steps involve creating a folder structure consisting of a project or root folder in which everything else is stored, and within this folder are four subfolders - data, docs, scratch, and scripts - each with a specific purpose. Once that is complete, we’ll create a new ArcGIS Pro project in the root folder and our workspace components will be complete. In the end, it will have the following structure:
ProjectFolder	• A directory on your local machine. Copy this folder to copy the entire project
 	/data		• Container for all spatial data and non-spatial data related to the project
	/docs		• Container for descriptive, help or other documentation related to the project
	/scratch		• Location for scratch data
	/scripts	 	• Container for any geoprocessing scripts used in the project
	/*.aprx		• The project's map document
	/*.tbx		• The project's toolbox
	/readme.txt	• A brief description of the project
-
Project folder and sub-folders Using Windows Explorer, create a project folder (we’ll call it
HurricaneMapProjectfor now) and the four subfolders for your hurricane project. **Always be sure that no spaces occur in the project folder name or anywhere in the path to this folder.** Spaces in file, folder, and path names can cause errors when certain ArcGIS tools are run. Use underscores if you need (e.g. “My_project”, not “My project”), but avoid spaces and other odd characters. -
The `readme.txt` file Create a new text named
README.txtin your project folder file. Use this file to store a few comments about the workspace - enough to briefly explain what the project is about, to differentiate it from other workspaces in case you or someone else revisits this workspace from a long hiatus. Include your name and the date. -
The ArcGIS Pro project and its components Open ArcGIS Pro and create a new blank project. Let’s name it “HurricaneMapper “and save it in a new folder on your class drive. Be sure the option to create a new folder for the project is NOT checked.
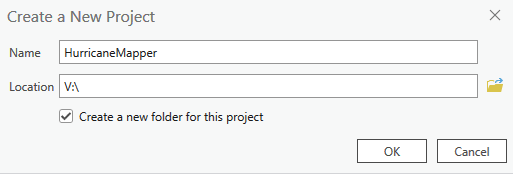
When you do this, ArcGIS Pro creates a new project file (
HurricaneMapper.aprx, a default toolbox (HurricaneMapper.tbx), and a default geodatabase (HurricaneMapper.gdb). -
Create a scratch geodatabase In the
Scratchfolder, create a scratch geodatabase calledscratch.gdb. You’ll have to do this from within ArcGIS Pro’scatalogpane by right-clicking on theDatabasesoption and selectingNew File Geodatabase.This scratch geodatabase is useful when you want an intermediate dataset to be stored within a geodatabase, e.g., when you want feature area and/or length to be automatically created.
-
Set geoprocessing environment variables Finally, you’ll want to set your geoprocessing environment variables - at least the workspace variables - for your project. This is done in the
Analysismenu, from theEnvironmentstab.- Set your Current Workspace to the
Datafolder. Or if you want to use the default geodatabase created when you created your ArcGIS Pro project instead, that’s fine too. - Set your Scratch Workspace to your the
Scratchfolder or theScratch.gdbgeodatabase.
Depending on other needs of your analysis, you might want to set other environment variables, but this will do for now.
- Set your Current Workspace to the
In the end your workspace should look like this. (You may have to refresh your HurricaneMapper folder in ArcGIS…)
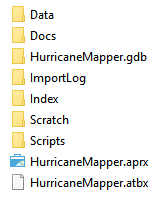
You now should have your workspace all set and should be ready to begin your analysis. Getting in the habit of starting each project by creating a workspace in this format will likely save you a lot of time and headache in the long run.
TIP: You may also want to include two subfolders in your “data” folder: “raw” and “derived”. This will allow you to distinguish datasets that you obtained to drive your analysis vs datasets produced by your analysis.
► See HurricaneMapProject_1a.zip for an example of proper workspace template.
1b. Adding data and tidying your project
The two datasets we’ll need include the hurricane track point data and a feature class of US Counties. We’ll download the hurricane track data and use an ESRI feature service as the source of our county data.
♦Fetch the hurricane track point data
Now that we have our workspace set, we’ll add the data required for the analysis. The hurricane track point data we want are held on the NOAA “International Best Track Archive for Climate Stewardship (IBTrACS)” website: https://www.ncdc.noaa.gov/ibtracs/. While both storm track points and track lines are available, we are going to obtain the storm track points - and just for the North Atlantic basin - and convert them in to lines.
-
Download the
IBTrACS.NA.list.v04r00.points.zipfile from https://www.ncei.noaa.gov/data/international-best-track-archive-for-climate-stewardship-ibtracs/v04r00/access/shapefile/IBTrACS.NA.list.v04r00.points.zip to your project’s “data” folder. Unzip the contents. TIP: You may want to include a short text file associated with the file(s) downloaded that include information on where (e.g. the web link) and when you obtained the data. This can be helpful if ever an updated dataset need be obtained or if you or others want to explore more about the data used in your analysis.
 -
Add the hurricane track point data to a map in your ArcGIS Pro project. Explore the data.
QUESTIONS:
• What is the spatial extent of the data set? Does it make sense?
• How many records are included in the dataset?
• What columns are included ? What is the earliest storm record contained the in dataset?
♦Fetch county feature data
We’ll also need county data. We’ll get this from an on-line source.
- In the ArcGIS Pro catalog search All Portal for
counties type:feature owner:esri_dm. You should find a county feature service namedU.S. Counties (Generalized)Add that to your map.
♦Tidy your dataset
Both datasets are now added to your project, but probably don’t have the best names or symbology.
- Take a moment to rename your map layers and symbolize them aesthetically.
- You may also want to select a basemap that is appropriate to your analysis.
Now we have a workspace set up and ready to go with all the data we need to execute our analysis!
► See HurricaneMapProject_1b.zip for a fully prepared workspace.
2. The Analytical Workflow & Geoprocessing Model
2a. “Pseudocode”
With our workspace prepared, we can now assemble our analytic workflow. In this section, we construct our geoprocessing model, reviewing key points regarding a basic model and some best practices for building them. We start with a concept called “pseudocode” which is simply writing out the logical workflow of our analysis from data to result, done in human - not software - terms.
Our workflow in this example is mostly straightforward. We want our model to:
- Select track points from a single storm, defined by its “Season” and its “Name”.
- Draw a storm track from these points and display the track on the map.
- Select the counties that intersect the storm track and display them separately.
So that is our pseudocode! Our next step is to leverage our GIS know-how to build this as a static geoprocessing model in our ArcGIS Pro workspace.
2b. Create the initial geoprocessing model
There are multiple ways to execute the workflow describe above. To be consistent, let’s all use the following process.
- Use the Select tool to select track points from
Season = 2018Name = FLORENCEinto a new feature class. - Use the Points to Line tool to convert these points to a line, using
ISO_timeas the Sort Field. - Use the Select Layer By Location tool to select county features intersecting the storm track line.
- Use the Copy Features tool to write the selected county features to a new feature class (in your scratch geodatabase for now).
- Set the model to add the results of the Points to Line and Copy Features tool are added to the display.
- Run each model process and ensure that they run smoothly and produce the expected results.
2c. Tidy the geoprocessing model
While our model now does what’s intended, a few remaining steps will make our model more useful and robust.
First, if you chose layers from your map to be the inputs for processes in your model, then your model won’t run properly if those layers are removed or renamed. Instead, if we point our inputs to the actual filenames in our workspace, the model will run independent of what’s displayed in the map.
-
Change the input of the initial Select tool to point to the
IBTrACS.NA.list.v04r00.points.shpfile in your data folder. Do this by opening the Select tool in your model and clicking on the icon to access the file in your data folder.
When you do this, your model “breaks”. Why?
Turns out that the name of the file is too complex for ArcGIS Pro’s liking (too many periods), so we’ll need to rename the file to something more simple like “IBTrACS_NA.shp”. I find the easiest way to rename shapefiles (since they are actually comprised of many files) is to rename the dataset in the ArcGIS Pro Catalog pane by right-clicking on the dataset. However, if this fails, another route is to use the Copy Features tool to copy the dataset, giving the output a new name and deleting the original.
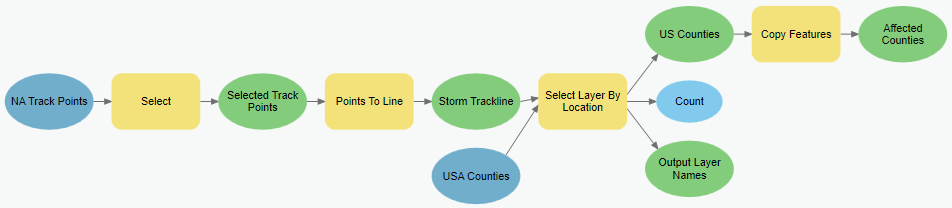
Next, in constructing you initial model, you may have simply left the variable names and filenames as their defaults. This works, but as your models grow more complex, you will find that organization pays dividends. So let’s take a moment to rename both the filenames of the products generated in each step as well as the names given to them in our model.
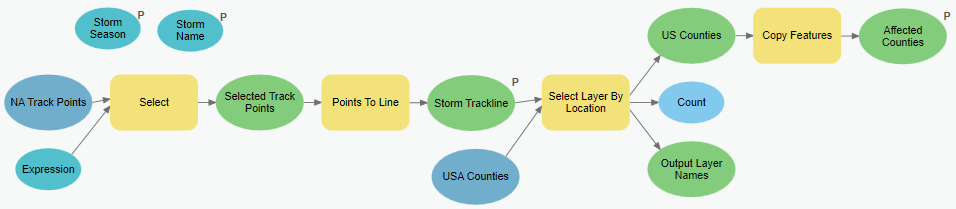
- Set the Select output to
Selected_Track_Pointsand rename its variable toSelected Track Points. - Set the Points To Line output to
Storm_Tracklineand its variable toStorm Trackline. - Repeat for the other processes in your model, with the final output called
Affected_Counties. - Validate your model to ensure it can find all the inputs it needs.
- Name and save your model.
Your model should now resemble this.
► See HurricaneMapProject_2.zip for a workspace completed to this stage.
3. From workflow to tool: parameters, symbology & variables
Our model seems to work fine, and it’s easy enough to tweak it to do the same analysis for a different storm by going into the model and changing the query statement in the Select process. However, we’re now going to look into a way that’s much more user-friendly; instead of requiring ourselves or others to dig into a specific process, we are going to set some model elements as parameters.
All this really means is that we are going to make some things in our model easily changed when running the model rather than the familiar editing of the model. To see what I mean, double click your Hurricane Map model to open it in “open” mode. You’ll get the “This tool has no parameters” message meaning that you can run the model, and it will run, but each time you run it, it’ll give the same result…
We are going to alter our model to explore different scenarios where the user can specify a specific storm and output name by setting model parameters.
3a. Setting up user parameters
♦ Creating a model parameter
- Open up your existing model (in edit mode). Right-click the last element in the model (likely called “Affected Counties”) and select “Model Parameter” from the dropdown list: a P should appear to the upper left of the model element indicating that it is now a model parameter. Let’s see what this means…
- Save your model and open it (in open, not edit mode). You’ll see that the user can now change the name of the output file prior to running the model. Feel free to give it a try. Notice also that the label given to the parameter in the tool dialog is the name of the element in your model that you set as the parameter (i.e., “Affected Counties”).
♦ Exposing a tool input as a model element and setting it as a parameter
- Next, we’ll create a parameter for the query expression used to select the storm year and name, but first we need expose the tools input as a variable.
- Right-click the Select tool and select “Create Variable > From Parameter > Expression”. This adds the query expression as an explicit element in your model.
- Now, right-click the new Expression variable and set it as a model parameter. Save the model. (And view it in the “open” mode again, if you’re curious.)
♦ Changing properties and order of model parameters
- Open up your model’s properties in the catalog pane, and select the Parameters tab. You’ll see some options you can apply to your parameters. We’ll make two changes here.
- First, change the order so that the Expression parameter appears first. Do this by clicking and dragging the row.
- Second, change the Expression parameter type from Optional to Required. Save your model and have a look at it in open mode.
- Now let’s run the model from the open mode, changing the storm season to
1996and the name toFRAN. Also, set the output to “Fran1996” in your scratch geodatabase. Check the results. (Does the model need fixing??) - On your own: Alter the model so that the track line (i.e., the output of the Points to Line tool) is set as the second model parameter (named “Storm Trackline”) and is added to the display.
► See HurricaneMapProject_3a.zip for a workspace completed to this stage.
3b. Set output symbology
As is now, we have no control over the symbology assigned to our model outputs. But we can change that.
- In your ArcGIS Pro map, symbolize the “Affected Counties” output as you’d want your model to create.
- Save this as a layer (.lyrx) file by right clicking on the layer, selecting Sharing > Save As Layer File, and save the layer file into your “scripts” folder.
- Open up your model’s properties again, and select the Parameters tab. In the row associated with your Affected_Counties parameters, way on the right side is a Symbology column. Click on the folder icon and navigate to the .lyrx file you just created.
- Clear any previous model outputs from your project and re-run your model. Now each time it runs, the output will have that symbology.
- On your own: Set your Hurricane Trackline output to show as a dashed red line.
3c. In-line variables
We see above how we can expose a parameter from a process, the Expression parameter from the Select tool in our case, so that we can use it as separate variable in the model, and ultimately as a parameter to the model. As a result, we’ve allowed the user to, at runtime, specify an expression query to select a specific storm via its name and season. Wouldn’t it be nice, however, if we could simply have the user input the name and year instead of a rigidly formatted query statement? In-Line model variables allow us to do just that – and more.
-
With your Hurricane model open in edit mode, right click anywhere in the white space and select Create Variable…. In the drop down menu, keep String as the variable’s data type and click OK. Right-click and rename this variable “Storm Name” in the model. Finally double-click to open the “Storm Name” variable and set its value to
FLORENCE. -
Create a second variable. This time, set its data type to Long, rename it to be “Storm Season”, and set its value to be
2018. -
Now open up the Expression variable in your model and edit it to read:
Season = %Season% AND Name = '%Storm Name%'
► Be sure that %Storm Name% is enclosed in single quotes…◄:'%Storm Name%'.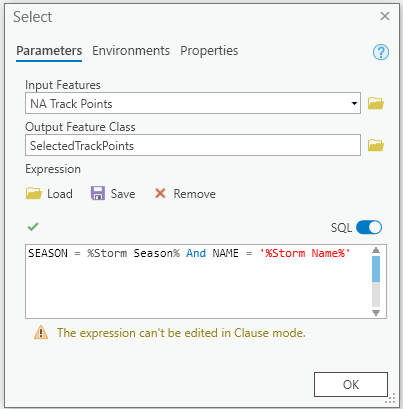
-
Set the Expression variable so that it is no longer a model parameter (or delete it altogether). And set both the Storm Season and Storm Name variables to be parameters. The result should look like this:
- Save the model and run it from the “open” mode. Try it for a different storm (e.g.
CAMILLEin1969) - What happens when you run the model for a non-existent storm, e.g.
Donaldin2020?
Let’s review what we just did. First we created two new variables, one to hold a string and one to hold a long integer . The values of these two variables are used inside the Expression parameter of the Select tool; whenever a model process encounters some variable name surrounded by two % signs, it searches for an element in the model with that variable name and inserts the value of that variable into the parameter.
You should note that while spaces are important in these variables names, capitalization is not. So, we could have named our variable “storm name” and it would be fine, but “StormName” would cause the model to become unreliable.
3d. Parameter filters
There are a few additional steps we can take to make our model a bit more polished and user-friendly. These involve putting filters on the values a user can input so that the model runs smoothly. Here we will tweak the model so that the user can select from a list of storms that occurred in 2005. Also, we’ll change the output name so that it includes the storm name in its filename.
- Edit the Hurricane model and set the Stotm Season element so that it is no longer a parameter, but ensure that its value is 2018. (This locks our model to only use named storms from 2018.)
- Save the model and then open up its properties. Select the Parameters tag, and change None in the “Storm Name” filters to Value List. In the value list window add the following entries: ALBERTO, BERYL, CHRIS, ERNESTO, FLORENCE, MICHAEL.
- Close the model properties window and then run the model, using
DENNISas the storm. See how the model now restricts the user from entering an incorrect name?
► See HurricaneMapProject_3d.zip for a workspace completed to this stage.
4. Conditional processing in a geoprocessing model
Virtually all the geoprocessing models you’ve created so far follow a linear path from start to finish. But what if we wanted our model to execute a set of processes only if needed or when a certain condition was met? For example, what if we wanted to add a field to a feature class, but only if that field did not already exist? Or project a raster unless the raster was already in the coordinate system? This too can be done in geoprocessing models.
4a. Using preconditions
In this first exercise we’ll construct a very simple conditional process. It involves creating a precondition, which is a variable linked to a process so that the process only runs if that precondition exists. In our case, we’re going to add a check to our model so that it exists if no storm tracks meet the user’s selection criteria.
- Open your Hurricane model in edit mode. Make sure that both Storm Season and Storm Name are set as parameters.
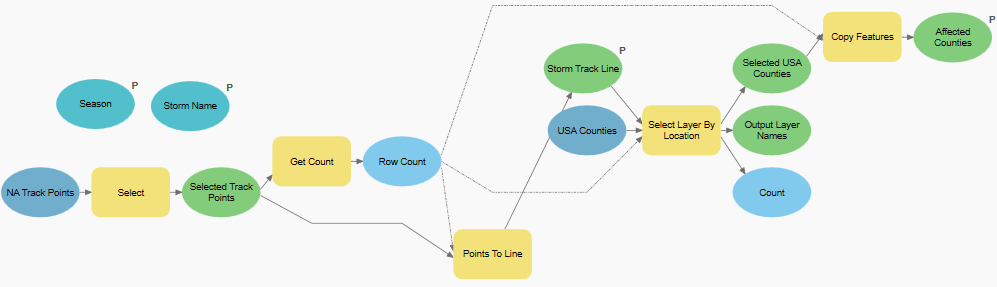
- Add the Get Count tool to the model, and use the Track Points (Select process output) as the Row Inputs for this tool. Now, if no records are selected that meet the select expression, the Row Count will be zero – the equivalent of false in terms of a precondition.
- Connect the Row Count object to the Points To Line process, selecting Precondition from the dropdown menu. This restricts the Points To Line process to run only if Row Count is considered “True” (i.e., if it’s value is not zero).
- Set the Row Count to be a precondition to the Select Layer By Location process as well.
- Save the model and run it (via “open” not “edit”), giving a bogus season (e.g.
2050). You’ll see in the model spawns a warning and stops does not execute the Points to Line tool or any tool after that because its precondition is false (Row count = 0).
As seen in the above example, using a precondition is fairly straightforward and can be quite useful, particularly in preventing a long model process to run when the inputs are bogus.
- **On your own**: Put a precondition on the Copy Features process such that it will only execute if the Storm Trackline intersects at least one county.
4b. Branching and merging
Next, we’re going to look at a more sophisticated example. Here we are going to give the user the option of writing out the counties affected by the storm track or just the storm track line. We’ll do this by adding a Boolean variable (shown as a checkbox) in the tool’s interface: if the box is checked, the model will produce the counties affected by the storm track, but if it’s not checked it will only produce the storm’s track line.
- Add a new variable to your model. Set its data type to Boolean, and rename it “Extract counties?”. Set its value to True by opening it and checking the box. Set the variable to be a model parameter.
- Set the Select Layer By Location process so that it will only run if the Extract counties? Boolean variable is True (via precondition).
- Ensure that the output of the Points To Line tool (“Storm Trackline”) is set to “Add To Display”, but that it’s not set as a model parameter.
- Also ensure that the output of the Copy Features tool (“Affected Counties”) is set to “Add To Display” but is not a model parameter.
- Add the Merge Branch tool (from the Logical dropdown in the Insert ribbon menu, when the ModelBuilder Diagram ribbon is active) to your model. Set its “in values” to be the results of both Copy Features (the “Affected Counties” element) and Points To Line (the “Storm Trackline”) tools – in that order. (Read the help associated with the Merge Branch tool and be sure you understand why).
- Rename the output of the Merge Branch tool element to “Model output”. Also, set it to be a model parameter and add it to the display.
- Save the model and remove and previous model outputs from your map. Run your model twice: once with the “Extract Counties?” unchecked as true and once with it checked. How does your model respond to the value of the Boolean checkbox?
The above exercise demonstrates the two key components of controlling flow: an evaluation statement that branches the flow along two or more paths and a merging tool that resumes a single linear flow in the model. The evaluation statement can be quite involved, as shown in the ArcGIS help. However, while conditional processing can be done in a geoprocessing model, anything beyond a simple precondition can get complicated pretty quickly. I will argue later in this course that, if Python is required to do anything but the simplest conditional branching, perhaps its best to construct the entire model as a Python script. But that’s a few sections away…
► See HurricaneMapProject_4.zip for a workspace completed to this stage.
5. Looping and iteration in a geoprocessing model
Geoprocessing models are great for repeating the same analysis over and over with different inputs. We’ve just seen how easy it is to add a few parameters our original hurricane model so that we can run it for any hurricane for which we know its name and season. Still, if we wanted to run this for 10 hurricanes, we’re going to have to babysit the process and enter a new hurricane name after each run.
Fortunately, some techniques are available to iterate models through multiple values. In the following exercise we will explore how to run our model once, but in doing so complete the analysis for several storms with outputs generated for each. In this case, we will use one of several “model-only” tools, i.e., tools that are designed to control the processing within a model, and thus are only available within a model and not from any toolbox.
5a. Iteration with a For iterator
In the example below, we modify our model so that it creates a storm track feature class for the first storm of the year over a set span of years.
- First, let’s simplify our model and just produce the track lines, not the intersecting counties.
- Delete every process except for the Select, Get Count, and Points To Line ones. Also, delete the Expression, Storm Season, and Storm Name variables if they exist in your model.
- Next, we need to revise our input storm track point dataset. Currently, we only have the track points occurring in the North American basin; here, we want to include tracks from all basins. We could download this feature class from the same location we grabbed the NA track points, but instead, we’ll link to an on-line web service that I’ve hosted on ArcGIS Online:
- Open the NA Track Points element in your model and change its value to the URL associated with the feature service:
https://services1.arcgis.com/XBhYkoXKJCRHbe7M/arcgis/rest/services/IBTrACS_since1980_list_v04r00_points/FeatureServer/0 - Rename the element to “All Track Points”.
- Open the NA Track Points element in your model and change its value to the URL associated with the feature service:
- Next, we are going to add an iterator variable. In our example, we will use a For iterator.
- From the Insert ribbon menu, select Iterators>For to add the iterator to your model.
- Open up the For iterator and set the From value to
2010, the To value to2018, and set the By value at2. - Rename the “Value” output of the iterator to Storm Season.
- Optionally, set the Storm Season variable to be a precondition to the Select process. (The model will work without this, but it does make for a tidier model diagram.)
- Now we need to modify the expression in the Select tool so that it selects the first storm for the year specified in the For loop.
- Edit the expression in the exising Select tool to read:
SEASON = %Season% AND NUMBER = 1.
- Edit the expression in the exising Select tool to read:
- If we ran our model now, it would repeat the analysis for the values we set in our iterator (2010, 2012, 2014, 2016, and 2018). However, for each run, the output produced would overwrite the previous iteration’s output as they all have the same name (“Storm_Trackline”). So, we need to alter our model so that it uses a unique name on every iteration. Fortunately, we can do this simply by including our inline
%Storm Season%variable the name of the file generated by the Points To Line process.- Open the Points To Line tool in your model and set its Output Feature Class to be
trackline_%Storm Season%(in the Scratch or the HurricaneMapper geodatabase.
- Open the Points To Line tool in your model and set its Output Feature Class to be
- Finally, to allow the output to appear on our map, we need the Collect Values tool, available in the Utilities dropdown in the Insert ribbon menu. Add this tool to your model and connect the output of the Points To Line process (i.e. “Storm Trackline”) to it. Also, ensure that “Storm Tracklines” is not set to add to display and that it is not a model parameter. Instead, set the output of the Collect Values too is set to add to display and is a model parameter.
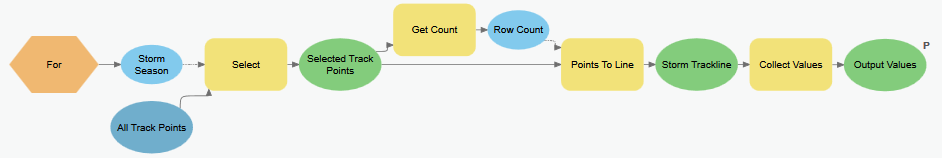
- Save the model, validate it (this resets the iterator) and run it (either from Edit or Open mode). Note that the outputs do not get added to the display, but check your geodatabase and you should have the 7 county feature classes – one for each storm added to your storm names list.
- **On your own**: See if you can modify this model so that the start and end seasons are set as user parameters.
In the above exercise, the For iterator caused the model to run for a span of years. We also used in-line variables to control the output name so that we didn’t simply write the model output to the same filename each time (resulting in only one output).
Consult the desktop help to see how other iterators work. Instead of a for loop, we could have used other objects, such as rasters in a workspace, values in a field, rows in a table, etc., and loop through unique values in them and execute a process. Iterators can be a bit tricky to set up, but you can see that they can be quite useful in letting the computer process a number of repetitive tasks without our help.
► See HurricaneMapProject_5.zip for a workspace completed to this stage.
6. User interactivity
ArcGIS Desktop had a nice data type called “Feature Set” that allowed you to create a feature class on the fly in a geoprocessing model. This was discontinued in ArcGIS Pro, but now some built-in geoprocessing tools allow you to do the same thing. Why this is important is that this allows your tools to be graphically interactive: the user can draw a point, line, or polygon as the input to a process. For example, instead of using a hurricane track generated from point data, the user can draw his or her own track to run the model!
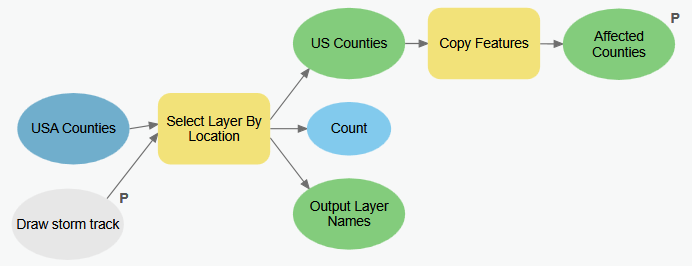
- Edit your Hurricane model (a version made prior to Step 5/iteration), removing all components that lead up to and including the Tracklines feature class such that it only includes the Select Layer By Location and Copy Features processes.
- Add a new variable to your model, setting its type to Feature Set. Rename it as “Draw storm track” and set it as a model parameter.
- Reorder your model parameters so that the Draw storm track is first.
- Save and the run your model, using the Pencil icon to draw a polyline on the map.
► See HurricaneMapProject_6.zip for a workspace completed to this stage.
7. Documenting your tool
If you wish to provide your model for someone else to you, and that someone else could be you a few months down the road when you may have forgotten exactly how to use it, you’re going to want to document your model. Documentation can be brief or detailed; what’s important is that you include enough detail so that the intended user has enough information for him or her to use it without too much difficulty.
- Make a copy of your tool created in Step 4b naming this tool “Hurricane Mapping Tool”
- Right-click the tool and select Edit Metadata. This brings up the form in which you can document your tool.
- Add tags which will allow others to search for your tool, e.g., Hurricane, ENV859, …
- The summary of the tool is what’s shown when the user opens up the tool. Type something you’ll recognize here.
- Expand the Syntax area. This is where you give descriptions for the various parameters your model contains. Enter some text for the input and output parameters for your model in both the dialog and the scripting explanation boxes.
- Add your name to the Credits box. If you want to be fancy, you can hold down the alt-key while pressing 0169 in the keypad to create the copyright symbol (©)
- Notice all the other places where you can add documentation and metadata for your model. We won’t fill out everything for out model, but if you want to distribute your tools widely, you should consider these other model attributes.
- Save the edits and close the description window.
- Close your ArcGIS Pro project (this is a bug as edits won’t “take” unless you restart ArcGIS Pro…).
- Open up your model and hover the mouse over the help icons to view the documentation you added. Click through the various parameters and see where your entered text appears.
- Click on the Tool Help button. A web page comes up with some of the model metadata you added.
► See HurricaneMapProject_7.zip for a workspace completed to this stage.
8. Sharing your tool
If your workspace and data are well organized, your map and models set to relative path names, and your tool nicely documented, you can simply zip up the contents of your root folder into a single zip file and send that off to anyone with the same version of ArcGIS and they should be able to use it.
- Run the hurricane tool once to produce some output.
- Select the Share menu within ArcGIS Pro
- Select Geoprocessing
- Select Web Tool, choosing the tool you just ran from the list. This will open the Geoprocessing Package pane.
- Edit the name of your tool, include your Duke NetID so the name is unique
- Add info such
summary,tags,etc. - Optionally, place your geoprocessing package in a subfolder you’ve created in your AGOL account.
- Share the tool with the
ENV859_2020group. - Click Analyze to see if you have any issues sharing your tool.
- If none, select
Package. This generates a geoprocessing package and uploads it to your ArcGIS online account. - When complete, navigate to your AGOL page.
- From there, you can see you can download your tool as a Geoprocessing Package (Consult the documentation how these can be used: https://pro.arcgis.com/en/pro-app/help/analysis/geoprocessing/share-analysis/use-a-geoprocessing-package.htm
Alternatively, you can simply tidy (i.e. clean out your scratch folder and remove all other extraneous files) your workspace, zipped the entire folder into a single Zip file and distribute that.
Recap
You’ve now run through the entire process for creating a robust, powerful, and user-friendly geoprocessing tool that you can share with others. The hurricane tool we’ve used as a basis for this exercise is a fairly simple one, but you should be able to envision that these tools can be quite complex under the hood, but present themselves as useful tools that others with very little GIS experience can us.
Thinking ahead, in running through these exercises, you’ve also previewed a number of important concepts relating to our next section: Programming in Python. Turns out, workspace set up, variables & data types, conditional execution, and iteration are all important and useful components in building script based tools. Yes, there will be a bit of learning curve in moving to a scripting environment for your tool-building. However, you should soon appreciate that the move pays quite big dividends in terms of what your tool can do and how easily it can be done…