Assignment: Cloud based GIS
Overview
- Download the zip file from here and unpack it to a local drive. This workspace includes a data folder, a notebooks folder, and a link to open the
gisPython environment we’ve been using. It also includes a file namedurl.txtwhich is referred to at the end of Task 2.1. - Part 1 deals with uploading data to ArcGIS online, analyzing it and sharing your results.
- Part 2 deals with pulling data into Python using techniques, using APIs, and using the ArcGIS Python API
Part 1: Using ArcGIS Online
Task 1.1: Uploading CSV data and sharing as a feature layer
-
Download the following file to your local machine: Animal_Feed_Operation_Permits_(View).csv
These data represent animal operations in NC, defined as feedlots involving more than 250 swine, 100 confined cattle, 75 horses, 1,000 sheep or 30,000 poultry with a liquid waste management system. The coordinates in this data set are referenced to the WGS 84 GCS (wkid=4326). -
Log into you NSOE account: https://dukeuniv.maps.arcgis.com.
-
Create a content folder called “
859_PS6”. -
Import the downloaded CSV file to this folder and create a hosted feature layer.
-
Create/edit the following general metadata items to the feature layer (you can leave the uploaded CSV file as is):
Metadata Item Metadata to include Title Animal_Feed_Operation_Permits_(<netID>)” (Replacing <netID> with your own Duke Net ID…)Categories Infrastructure/Agriculture Tags ENV859_2022 Summary Animal Feed Operations in North Carolina Description These data represent animal operations in NC, defined as feedlots involving more than 250 swine, 100 confined cattle, 75 horses, 1,000 sheep or 30,000 poultry with a liquid waste management system. The coordinates in this data set are referenced to the WGS 84 GCS (wkid=4326).
Source: https://www.nconemap.gov/datasets/ncdenr::animal-feed-operation-permits-viewTerms of Use For class exercise only -
Change the default visibility of the layer to something other than orange dots. For example, set the layer to show
permit statusas different colors, set theallow countas different symbol sizes or colors, use clustering, or create a heat map from the points. -
Share the feature layer with the ENV859_2022 group.
Task 1.2: Analyzing the data & sharing results
In this task, we want to explore whether the level of permitted animal farm operations is related to the frequency of respiratory illness. We have just imported the animal permit locations above as a series of points tagged with the permit type, the number of permitted animals, and the total live weight of animals at the site. Here, we’ll add that to an ArcGIS Online map and also add the EPA’s EJSCREEN dataset - a dataset of many environmental justice screening indicators at various spatial resolutions. One of the EJSCREEN indicators is the National Air Toxics Assessment Respiratory Hazard Index.
Through the steps below, we will construct a web map with these datasets and use them to compare levels of permitted animal operations to the respiratory hazard index – all using ArcGIS Online.
-
Open your Animal Feed Operations data layer in a new ArcGIS Online Map (Classic version).
-
The ESRI REST endpoint for the EPA EJSCREEN data is here (open in a new browser tab):
https://ejscreen.epa.gov/arcgis/rest/services/ejscreen
You’ll see a number of map services hosted here. Open theEnvironmental Indicators 2019 Publicmap service page. -
Among the layers of this map service is the one for
NATA Respiratory HI- the one we want. Copy the URL associated with that link and use it to add this layer to your map.(Hint: Use the
Add Layer from Weboption…) -
Filter the the EJSCREEN Environmental Indicators dataset so just North Carolina records are displayed.
Note: I’ve noticed erratic behavior as this layer is displays: some features appear to be missing. However, the data should all be there, so you can ignore this issue. -
Use the appropriate analytical tool in ArcGIS online (this can all be done with just one analytical tool…) to create a new dataset that includes the following:
- The count of animal permits in each tract
- The sum number of permitted animals in each tract
- The sum weight of live animals permitted in each tract
→ Before you run this, note how many credits this analysis consumes
Save your result as “
Permits_vs_Respiratory_<netID>” (replacing /with your Duke NetID). -
Symbolize your result to show the relationship among respiratory hazard and total allowable count of animals. To do this, select both the
B RESPandSub allow_countattributes in theChange Stylewindow. Then select the ‘Relationship’ drawing type. On completion, your legend should appear as follows: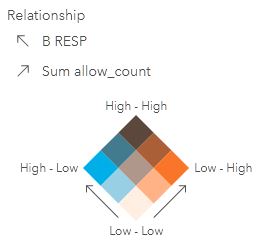
-
Share this resulting feature layer with the
ENV859_2022group. -
Save and share your map with the
ENV859_2022group, naming itPS6_Task1_<netID>and assigning it the tagENV859_2022_PS6. and the summary “Relation of animal operations with respiratory hazard”.Take note of the link to your map. Open the url.txt file in your downloaded workspace and paste it in there.
Part 2
Option 1 - Dashboards
Create an ArcGIS Online Dashboard or ArcGIS Insights document based on the above data. You are welcome to add new datasets to your application. This application should have the following:
- At least two widgets (map/table/plot)
- Interactive filtering or subsetting of data
- Linked views (selection, panning, or zooming in on widget will automatically select, pan, zoom in another widget)
Share your application with the ENV859_2022 group and submit your shared URL in the url.txt
- OR -
Part 2/Option 2 - GIS and Web Services
Complete the following notebooks located in your downloaded workspace.
| Notebook | Shortcut |
|---|---|
| 1-Accessing-data.ipynb | Open_Jupyter_gis.bat |
| 2-Web-services-and-REST-APIs.ipynb | Open_Jupyter_gis.bat |
| 3-ArcGIS-Python-API.ipynb | Open_Jupyter_arcgis.bat |
Submission
When finished, zip the contents of your downloaded workspace, and submit to Sakai.