Prep Questions
Prep Questions
- Did you complete all sections 1-5? (Issues with deep learning?)
- Which was your favorite?
- What are some things you got out of taking the MOOC?
- Do you think this material should be taught at NSOE?
General Questions
1. Data Engineering & Visualization
- Did you know that ArcGIS Pro could do interactive visualization
2. Forest-based classification
3. Suitability Modeling
4. Pattern detection & clustering
5. Deep Learning & Neural Networks
- Did you have any idea of what these things mean before doing this section?
- Do you feel like you have a decent grasp of the concepts this discusses?
- Do you see any applications where this could be useful?
6. AGOL
Section 1.
- An analyst has a dataset of coffee shop locations and their yearly sales. How does geoenrichment add demographic variables to this dataset?
- Geoenrichment uses the underlying demographic variables of the census geography (county, census tract, and so on) that the coffee shops fall within.
- Geoenrichment draws a polygon around the coffee shop locations and takes a portion of the underlying demographic variables based on the overlapping area of that polygon.
- Geoenrichment draws a polygon around the coffee shop locations and apportions the demographic variables that get assigned to each coffee shop using the underlying population.
-
The following spreadsheet has over 30,000 records of well information, including the well permit number, operator, status, type, latitude, longitude, and county name. An analyst wants to visualize this data in a map, specifically the location of each well and its status. Which data engineering tasks are required to prepare this data?
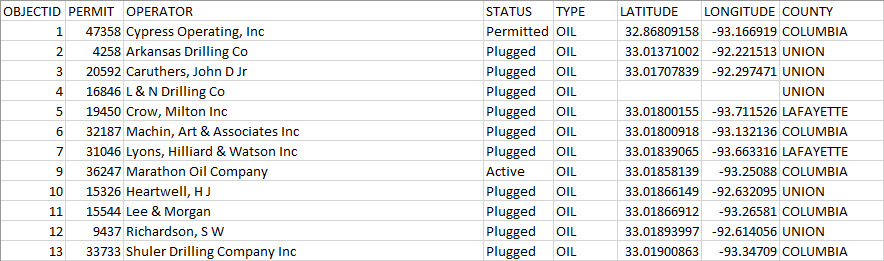
- Search for and correct records with null longitude and latitude values.
- Pivot the data based on county.
- Geoenrich the spreadsheet to include the population around each well.
-
Which data visualization technique visualizes the relationship between two numeric variables where one variable is displayed on the x-axis, and the other variable is displayed on the y-axis?
- Bar chart
- Box plot
- Scatter plot
Section 2.
-
Which predictive analysis tool uses decision trees to create a set of rules that predicts a feature category or value based on explanatory variables?
- Generalized Linear Regression
- Forest-based Classification and Regression
- Geographically Weighted Regression
- [ ]
-
Which of the following charts help you evaluate the results of a model when you choose multiple runs for validation? (Choose two).
- Distribution Of Variable Importance box plot
- Variable Relationship scatter plot matrix
- Validation R2 histogram
- Variable Importance bar chart
-
An analyst is training a prediction model that will forecast annual store revenue using Forest-based Classification and Regression. The analyst has the following datasets:
- Stores: a feature layer of store locations that includes attributes for current store revenue and surrounding demographics
- Universities: a feature layer of university locations that includes attributes for surrounding demographics
Which of the following is the most efficient way to incorporate the distance to universities as a variable in the model?
- Calculate the distance from each store to the university locations, and then add this new attribute to the explanatory training variables.
- Add the Universities feature layer as an explanatory training distance feature.
- Merge the attributes from the Stores layer to the Universities layer, and then add the Universities layer attributes to the explanatory training variables.
-
Which diagnostic evaluates model performance based on the data that is randomly excluded from each decision tree?
- Prediction Interval
- R-Squared
- Out Of Bag Errors
Section 3.
- Which of the following workflows lists the correctly ordered steps of suitability analysis?
- Identify the criteria, weight and combine criteria, transform criteria values, derive the criteria, locate the site
- Identify the criteria, derive the criteria, transform criteria values, weight and combine criteria, locate the site
- Identify the criteria, derive the criteria, weight end combine criteria, transform criteria values, locate the site
- Which of the following definitions describes the process of transforming criteria values?
- Converting criteria values to a common scale
- Deriving the criteria values from base datasets
- Assigning weights to the criteria values
- An analyst wants to identify the most suitable location for a wind farm. One of the criteria is slope. The analyst will use digital elevation model to create a dataset that represents slope. This example demonstrates which step in suitability modeling?
- Transforming criteria values
- Deriving the criteria
- Weighting end combining criteria
- An analyst is transforming criteria values to a common scale so that the criteria can be weighted end combined. Which of the following tools should the analyst use to transform criterion with continuous values, like the distance from major roads, to a scale where preference increases as distance increases?
- Reclassify
- Rescale by Function
- Weighted Sum is used to weight the criteria after each has been transformed to a common scale
Section 4.
-
For which of the following reasons would hotspot analysis be used?
- To identify areas where high and low values cluster together in a non-random way
- To improve the appearance of maps by enhancing the resolution of the data
- To clarify the focus of maps by identifying the central point of the data’s distribution
-
Which of the following analysis questions can be answered using hot spot analysis?
- Do any school districts have graduation rates that ere very different from their neighboring school districts?
- Which school districts are part of statistically significant clusters of high graduation rates?
- Where are the highest graduation rates in the dataset?
-
An outlier analysis generated the following map of clusters and outliers. Which of the following map areas includes low-high outliers?

- Area A
- Area B
- Area C
-
What does it mean to be a high-low outlier?
- A feature with a high value surrounded by features with low values
- A feature with a low value surrounded by features with high values
- A feature with a low value surrounded by features with low values
-
Which of the following statements describes how neighbors are defined for each bin in a space-time cube?
- The bins that are closest in space are considered neighbors.
- The bins that are closest in time are considered neighbors.
- The bins that are closest in both space and in time are considered neighbors.
Section 5.
- What is the relationship between artificial intelligence, machine learning, and deep learning?
- Deep learning is a broad broad that encompasses artificial intelligence and machine learning.
- Machine earning is a broad broad that encompasses deep earning and artificial intelligence.
- Artificial intelligence is a broad term that encompasses machine learning and deep learning.
- What is the name of the processing unit that makes up a neural network?
- Neuron
- Layer
- Activation function
- What is the first step in object detection using a deep learning model?
- Training the model using a convolutional neural network
- Preparing raining samples as image chips
- Performing inferencing to detect objects
- Which of the following parameters defines the number of times that the image chips will be processed by the neural network?
- Stride
- Learning rate
- Epochs
- An analyst wants to be at least 90 percent confident that the objects detected using a deep learning mode are accurate. Which parameter can the analyst use to define this confidence level?
- Threshold
- Padding
- Non-maximum suppression
Section 6.
- An analyst is sharing the results of a suitability model with corporate decision makers. Which of the following products is the best way to communicate the analysis results to this audience?
- A model in ModelBuilder that visualizes the tools, input parameters, and resulting layers
- An ArcGIS StoryMaps story that uses images, maps, and text to explain the results of the analysis
- An ArcGIS Notebook that lists the code used to create the model and embedded maps of the resulting outputs
- An analyst is creating a story using ArcGIS StoryMaps to communicate the results of a recent analysis. From the story builder, how can the analyst create a map that allows decision makers to dynamically visualize the study area of the analysis?
- Create an express map zoomed to the study area.
- Use content blocks to add an image of the study area map.
- Publish the analysis map to the story, turning off layers to focus on the study area.
- An analyst is creating a story using ArcGIS StoryMaps to communicate the results of a recent analysis. Which of the following actions must the analyst take to add a map to the story that was created by a person outside their ArcGIS Online organization?
- Add the map to the analysts favorites list and then add the map to the story.
- Add the map layers to an express map that the analyst creates within the story.
- Search through the list of My Maps and then add the map to the story.
- An analyst is creating a story using ArcGIS StoryMaps that will communicate the results of a recent analysis. Hew can the analyst add a series of slides that include graphics and text, providing an immersive experience for the reader?
- Add each graphic as an image and include the text in the image captions.
- Add a sidecar or slideshow block that shows graphics in the media pane and text in the narrative panel.
- Add the graphics as images and the text as quotes, using a separator between each image and associated quote.