ArcPy - Writing a geoprocessing script - I
♦ Introduction🎞️
In our previous sessions, we introduced Python modules and packages and how they extend what base Python can do. In this session, we dive into into one particularly useful package: ESRI’s ArcPy. This package, which comes as part of installing ArcGIS (Pro or Desktop), enables us to do virtually anything we can do in ArcGIS - and even a bit more - from the Python coding environment. Why bother doing in Python what we can do with the nice graphical user interface of ArcGIS?? Well, I hope to answer this in this first of two part exercise…
To simulate how you might go about learning ArcPy, or any other complex Python package, we will learn by doing. Specifically, we are presented with a geoprocessing task - one uniquely suited for combining Python and GIS - and use that as our context for learning what ArcPy does, how it does it, and how to continue learning what else it can do.
As just mentioned, this is part 1 of a two part exercise. Here, I present you with the scenario and outline a pathway for tackling the overall objective. The idea is to (1) get more practice tackling a Python scripting exercise and (2) demonstrate a need for ArcPy. (Prime the pump, as it were…). Following this exercise, we’ll pause and then have a more formal introduction to the ArcPy package. And following that, we’ll return to this project and implement the ArcPy knowledge we just learned.
The Scenario
You’ve been sent a folder with a number of raw ARGOS tracking data files. Your job is to convert these text files into a single feature class containing all the location points for the various critters that have been tracked. If done by hand, this presents a monumental task, so instead we are going to invest the time to write a script that will do this for us – and the script can be reused quite easily if ever we are given another batch of ARGOS data.
Note: these are actual ARGOS data on sea turtle movement generously provided to us by Duke professor Scott Eckert. Scott is pleased that we’re using these data, but if you wish to use the data beyond this lab exercise, please contact him directly for permission to use his data: Scott Eckert [seckert@widecast.org]
Learning Objectives
| Topics | Learning Objectives |
|---|---|
| Preparing for the task | • Setting up a proper development environment • Constructing the ArcGIS Pro workspace • Creating and configuring a GitHub workspace • Creating your Spyder shortcut |
| Getting started | • Approaching the task: looking for patterns • Developing pseudocode for your objective • Starting your script: boilerplate code and package imports |
| Tackling your coding task | • Moving ahead with what Python you know • Learning more Python as you go |
♦ Preparing for the task🎞️
We are going to use a combination of ArcGIS Pro/ArcPy, VSCode, and GitHub to accomplish our task. To do this, we’ll need to:
- Set up our development environment;
- Construct a proper ArcGIS workspace; and
- Create a Git repository set up in that workspace’s Scripts folder.
1. Construct a proper ArcGIS Pro workspace
- Unpack the zipped workspace found here to your V: drive; this is a pre-configured workspace.
2. Create a scripting workspace within the ArcGIS Pro workspace
-
Add a new folder called ‘
ARGOSDataToFeatures’ in your ArcGIS Pro project folder. (It should be at the same level as the ‘Data’ folder.)This “ARGOSDataToFeatures” will be your “Scripts” folder. We name it this so it appears with that name in GitHub.
-
Open this folder in VSCode and “trust the authors” in this folder and the parent folder.
-
Add a Readme.txt file to this folder and add text to indicate what this project is.
(👉You can actually copy the README.txt file found in the project folder.)
3. Enable version control in this folder
- Click on the Source Control button and Initialize the Repository for this folder.
- Stage and bthe Readme.txt file.
- Publish the repository on GitHub.
- View the repository on GitHub to ensure all looks good.
4. Rename the folder back to “Scripts”
- Close VS Code
- In a Windows file explorer window, rename the folder to “Scripts”
To discuss in class:
Why don’t we apply version control the entire ArcGIS Pro workspace?
♦ Getting started🎞️
Like any geoprocessing task, the initial scope of this project may seem daunting. The key is to break the overall task down into smaller, more concrete tasks – ones that we can more easily imagine how they might be done with what we know about scripting and geoprocessing. What we need to do is familiarize ourselves with the inputs and outputs, the general processing steps, and creating a rough flow diagram showing the incremental steps getting from inputs to outputs.
1. Examine the inputs – look for patterns
Before embarking on our flow diagram, let’s first take a look at our inputs, i.e. the raw ARGOS data files. These files are located in the ARGOSData folder within the Data folder of the ARGOSTracking workspace provided for this exercise. Open up any one of the files and examine the format. One essential feature of these files that we’ll capitalize on is that the each single observation record within them follows a standard format:
17712  Date : 28.01.97 01:25:59  LC : B  IQ : 00
       Lat1 : 18.200N  Lon1 : 103.288W  Lat2 : 17.381N  Lon2 : 107.075W
       Nb mes : 002  Nb mes>-120dB : 000  Best level : -129 dB
       Pass duration : 058s   NOPC : 1
       Calcul freq : 401 650084.8 Hz   Altitude :    0 m
              183           00           00           00
               00           00           02           77
               55          186           07          225
When something is standardized like this, it means we can reuse code in our script to process the data in loop rather than have to write code to handle each data point sequentially. Writing our script just got a whole lot easier because we only have to write a script to process that little chunk above, and then tweak it a little bit so it can iterate through all the little chunks like the one above that reside in all our input data files.
2. Break down the process and develop your pseudocode
Always keep in mind what the end result of your script should be. Here, it should be a feature class containing points – one point representing each observation record like the one above. You see that it contains a set of lat-long coordinates (two actually, but we’ll worry about that later). We’ll somehow need to use those coordinates to create the point that will be used in our output feature class, and if we can do it for one ARGOS observation coordinate pair, then we should be able to construct a loop do to it for all of them.
Let’s sketch out a rough diagram of our potential workflow:
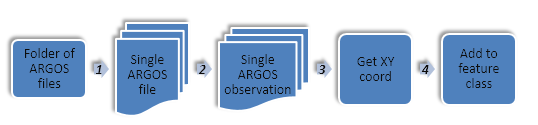
That’s enough to get us started at least. We can always adjust the steps to account for any unexpected tasks that might arise.
So the tasks we need to figure out are as follows:
- Given a folder containing several ARGOS data files, how to create a list of the files and loop through it one file at a time.
- Given a single ARGOS data file, how to extract individual ARGOS observation records in a way that allows us to loop through each record individually.
- Given a single ARGOS tracking observation, how to extract the lat-long coordinates and other observation attributes.
- Given a lat-long coordinate pair and other attribute information, how to create a point feature and add it to a point feature class.
That seems a bit more manageable. It’ll still take several references back to the Python and ArcPy help documents, but muddling our way though these tasks is far less intimidating than taking on the whole scripting project in one go.
Now the question is: where do we start? Is it best to start at step 1 and move sequentially? Should we start at step 4 and proceed backwards? There’s no correct answer to this – just a bit of strategizing. From experience, I’m inclined to start at step 2. Why? Simply because we can have an input be a single ARGOS data file. If we can get our script to work with a single data file input, it shouldn’t be too difficult to wrap that entire script within a for loop and run it for several inputs.
So let’s get coding!
♦ Getting started on the code🎞️
1. Starting the script: Boilerplate {link}
-
Create a new Python script in your Scripts folder, we’ll call it
ImportARGOS.py, and open it up in Spyder -
Add the following “boilerplate” code (modifying where necessary):
##--------------------------------------------------------------------- ## ImportARGOS.py ## ## Description: Read in ARGOS formatted tracking data and create a line ## feature class from the [filtered] tracking points ## ## Usage: ImportArgos <ARGOS folder> <Output feature class> ## ## Created: Fall 2023 ## Author: John.Fay@duke.edu (for ENV859) ##--------------------------------------------------------------------- -
Commit your new script to your GitHub repository
2. Import modules {link}
-
Add code to import the modules we think we’ll need (we can change this later):
# Import modules import sys, os, arcpy -
Commit the changes…
3. Set the input variables {link}
-
Add the following hard-wired input variables to your script:
# Set input variables (Hard-wired) inputFile = 'V:/ARGOSTracking/Data/ARGOSData/1997dg.txt' outputFC = "V:/ARGOSTracking/Scratch/ARGOStrack.shp" -
Commit the changes…
♦ Tackling Task 2: Extracting ARGOS observations from a data file
Our focus here is to extract each observation record, one at a time, from the text file containing the records. This is going to involve two sub-tasks: (1) Reading lines from a text file, and (2) being able to recognize and loop through individual observation records.
In case, we’ve discussed the Python file object and how it’s used to read a text file one line at a time. So now, open up the 1997dg.txt file in a text editor, and look at the structure of the ARGOS data file again, but this time from the perspective of the Python file object and how it works. If you need more info on the file object, find its entry in the Python documentation.
Notice how the first line in each tracking record is in the same format. If running through the text file one line at a time, every time we hit a line that has “Date :” we are encountering a new observation record. We’re going to exploit that fact and the fact that the line immediately following it contains the lat-long pair we need.
The following code does just that loops through each record in the inputFile and prints out the tagID and its geographic coordinates. Note also the heavy usage of string and list functions to split items on one line of the data file into a list of objects and to extract specific objects from that list
4. Read in and loop through each record in a single ARGOS file {link}
- Add the following block of code to your script
# Construct a while loop to iterate through all lines in the datafile
# Open the ARGOS data file for reading
inputFileObj = open(inputFile,'r')

# Get the first line of data, so we can use a while loop
lineString = inputFileObj.readline()

# Start the while loop
while lineString:

    # Set code to run only if the line contains the string "Date: "
    if ("Date :" in lineString):

        # Parse the line into a list
        lineData = lineString.split()

        # Extract attributes from the datum header line
        tagID = lineData[0]

        # Extract location info from the next line
        line2String = inputFileObj.readline()

        # Parse the line into a list
        line2Data = line2String.split()

        # Extract the date we need to variables
        obsLat = line2Data[2]
        obsLon= line2Data[5]

        # Print results to see how we're doing
        print (tagID,"Lat:"+obsLat,"Long:"+obsLon)

    # Move to the next line so the while loop progresses
    lineString = inputFileObj.readline()

#Close the file object
inputFileObj.close()
We just tackled Tasks 2 and 3! Did that seem easy? Well, yes and no. It takes some introspection into what objects in the list the $tagID$, $lat$ and $long$ coordinates are. This can be done by setting a break point just after the lineData = lineString.split() statement and then examining the list produced, specifically noting where within it each data element is found.
Challenge!
Can you modify the above script so that the
{Answer}
Summary - to this point & what’s next
Up to now, we’ve done everything we need with basic Python and some help with the os module. The following steps which begin with constructing an new ArcGIS feature class, however, require us to tap into ArcPy - one of the more complex Python packages. So… prior to continuing, we are going to pause and examine ArcPy, keeping in mind that we want to learn how, from Python commands, we can do the following:
- How to create a new feature class
- How to construct a point feature
- How to iteratively add point features a feature class, along with some attributes
- And generally, how we go about learning to use all there is to know about ArcPy
So, next up, let’s take a side step and look at this ArcPy package in more detail…