What is Data Science?
| Topics | Learning Objectives |
|---|---|
| What is Data Science? | • Explain why data science has become a “hot topic” these days • Discuss from what disciplines data science pulls from • Contrast data science from traditional statistics • Describe GIS in the context of the “data science revolution” |
| The Data Science Workflow | • List and describe each step in the traditional data science workflow 1. Defining the goal & workflow 2. Gather and prepare data 3. Explore and visualize data 4. Modeling and analysis 5. Sharing results • Explain the importance of reproducibility in data science |
| SciPy & Scientific Data Structures | • Differentiate a tidy data set from a messy one • List the components in the “SciPy Stack“ • Describe the benefits of NumPy and its n-dimensional array object • Describe the benefits of Pandas and its Series and Data Frame objects |
What is Data Science?🎞️
Seems everyone is talking about “data science” these days, and its certainly a hot skill to have in today’s job market. But what is it and why is it so popular? Well, the concept of “data science”, i.e. - the application of the scientific method, processes, etc. to data itself - is not entirely new. After all, the field of statistics, which arguably is pretty much just that, has been around for centuries.
But data science, as the term is used today, is slightly different than statistics, and this has everything to do with computers. First of all, computing power has far exceeded what any 18th, 19th, or perhaps any 20th century statistician could have imagined. Desktop computers can process more records in minutes than a room-sized server from the 1980s could in a day. And thus we are now able to run complex analyzes on entire populations of data vs small subsets.
Also, computers have become smaller and more ubiquitous. We live in an age where we’re expected to carry a smart phone instead of keys to allow us into buildings. We can control thermostats, lights, and even cars via wireless signals. And we share the most banal aspects of our day with our friends via social media apps. All this, combined with the fact that digital storage is getting cheaper and cheaper means that the amount of data being amassed is staggering.
So, we have super fast computers and an a deluge of data being collected and stored in various formats. Those are concepts traditional statistics was developed to handle. So, we have the emergence of a new field: Data Science!
Skills required for Data Science
One pithy description of a data scientists is: “A person who is better at statistics than any computer scientist and better at computer science than any statistician “. But really, data science is more than just stats and computer science know-how.
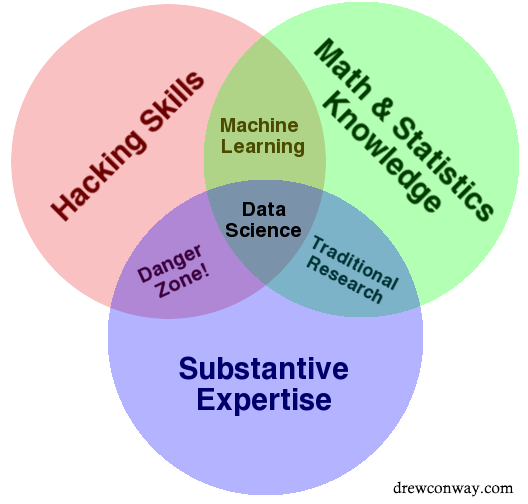
A nifty Venn diagram developed in 2010 by Drew Conway captures the idea that data science pulls from various disciplines, not just math and statistics. Like all Venn diagrams, it may oversimplify, but many find it useful in illustrating what skills are needed, and also where data science can be “abused”. (Personally, I’d tag the spot where “machine learning” is as another potential danger zone - running numbers without proper understanding of what the numbers are showing!)
👉 A nice description of Statistics vs Data Science:
https://www.displayr.com/statistics-vs-data-science-whats-the-difference/
GIS in the world of Data Science
GIS and data science are strongly intertwined. In fact, I often describe GIS as data science before data science became popular. More honestly, however, the two have evolved in roughly parallel paths for a long time. But the division is becoming more and more blurred, and makes for an exciting time to be a geospatial analyst!
Why?
For a few reasons. First, data scientists that are heavy on computer science and/or statistical backgrounds are eager to include location into their analyses. GIS brings a rich background of dealing with projections, spatial data formats, and spatial measurements to the table.
Second, more and more “big data” statistical analyses are being integrated into GIS software. While Python has long had packages to run deep learning, classification, space-time pattern mining, pattern detection analyses, they were often confusing and complex to use. More and more, however, these tools are being integrated into more user-friendly software like ArcGIS Pro making them far more accessible to people without in-depth knowledge of coding or scripting.
And finally, data science is formalizing itself from a bit of a “wild west” cadre of cool tools into a more established and organized set of methods. In particular, the promotion of “tidy data” and the “data science workflow” by people like Hadley Wickham is allowing a more organized march forward vs a constant reinventing of the wheel.
Let’s now take a look at these concepts of tidy data and the data science workflow as we focus on what I call “Practical Data Science”.
The Data Science Workflow
Obviously, we haven’t the time to cover everything about data science. Instead, we’ll focus on elements of data science that are useful to us as geospatial analysts, beginning with the data science workflow, sometimes referred to as the “data analysis pipeline”. ESRI has created an excellent overview of the data science workflow presented in the context of a spatial analysis exercise. The video is linked here, with associated slide deck here, a GitHub repo here and finally an ArcGIS Workspace containing the data used in the demo here.
👉Watch the video, then be prepared to discuss the following components of the workflow in class.👈
This video goes into more detail than we are prepared for right now (especially the use of Pandas in the code). However, it still provides a useful overview of the process and various considerations of executing a data science task. Review the questions below and then watch the video. And then revisit the questions to check your understanding. In our next synchronous section, we’ll discuss these questions and address any concepts you feel need clarifying.
1. Define the goal & the workflow (1:10)
- What is the overall goal of the analysis in the ESRI demonstration?
- What actions did they decide were useful in accomplishing this goal?
- Did any knowledge of GIS or data analytics directly factor into this decision?
Or was this more influenced by expert knowledge related to voting ?
- Did any knowledge of GIS or data analytics directly factor into this decision?
- What is their analysis question?
- What data would be useful in answering this question?
- Were they able to find the data needed to answer the question?
- How do they intend to overcome their data limitations?
- Do they expect to encounter any additional questions while performing this analysis?
2. Gather and prepare data (7:14)
- What technologies did they use to gather the data?
- What is like having an Excel spreadsheet in Python: Dictionary, Matrix, Data Frame, Vector?
- What is the challenge with importing FIPS codes?
- What are some techniques for dealing with missing data?
- What does it mean to “pivot” (or “transform”) a data table?
- How do Jupyter notebooks facilitate collaboration and reproducibility?
- What is an example of a data consistency check?
- How might computing summaries stats of fields help identify errors?
- How might visualizing the data help identify errors?
- Did you catch what Data Enrichment is?
3. Exploring and visualizing data (17:38)
- What do you think Flora meant when said Alberto gave her a rich and tidy dataset?
- What does the histogram of voter statistics reveal?
- Why is a standard deviation classification appropriate for viewing this attribute spatially?
- What kind of chart is used to view county voter summaries by state?
- How is Flora able to view the distribution of values within a selected state?
- What does the box plot reveal about the data?
- What does the scatterplot matrix reveal about the data?
- Do relationships shown in the scatterplot matrix vary geographically
- What does the Local Bivariate Relationships tool reveal?
4. Modeling your data (27:05)
- Did Alberto know which variables would be best suited for his Random Forest Analysis?
- Did he know how many iterations to run?
- Did he evaluate his output? And did it reveal anything about the variables he chose initially?
- Is the final model uniformly accurate across space? Or does it work better in some regions than others?
5. Using the results (36:51)
- In the end where the data science efforts useful? How was that determined?
- What might be the next steps if the results were flawed?
- Can you think of changes in the process that might have led to improved results?
- What do you think should happen next in this overall effort?
SciPy and Scientific Data Structures (In class)
The video above introduced the dataframe as a key component in gathering and organizing data. What is this data frame object and why didn’t we discuss it when we talked about other data structures in Python, namely lists, tuples, dictionaries, sets, etc?!? The short answer is that it’s because the dataframe is not a native Python object; it requires importing a 3rd party Python package. And Pandas is the go-to package for working with dataframes in Python.
A slide deck on Scientific Computing and Scientific Data Structures is provided here, with video to accompaniment provided linked on the web site. The key points are as follows:
- Scientific Computing is similar to Data Science in that it leverages advances in computational technology to assist scientific investigation.
- Tidy Data is a specific data format whereby data are stored in a table such that each row is a feature or observation, and each column is a particular description of that feature or record (much like the attribute table of a GIS feature class). Organizing data into a tidy format facilitates analysis of the data using standard programming languages.
- In R, the “TidyVerse” is a set of libraries used to work with tidy data.
- In Python, the SciPy Stack is a set of libraries used to work with tidy data. The most important libraries include:
- NumPy: used to work with numeric data in the form of vectors, matrices, and n-dimensional arrays
- Pandas: used to work with data stored in series an/or dataframes.
- GeoPandas and ESRI’s Spatially Enabled Dataframe which enable spatial analysis on data frames
- Matplotlib: used visualize data in many different formats and styles
In subsequent sessions, we’ll dive into these packages and more. Typical of this class, we won’t be able to go into too much depth with each; rather with limited time, our objectives will be to familiarize ourselves with the general structure of these modules and the key functions and classes they bring to the coding environment.