Assignment 1
Overview
Scenario
In this assignment, we want to examine the food sources within a set distance to various campuses across North Carolina, specifically whether “healthy” food sources are generally more or less available than “less healthy” ones. We could extend this analysis to allow us to compare historically black colleges and universities (HBCUs) to their predominantly white institution (PWI) counterparts, as well as provide the ability of a user to count the number of food source types within a distance of a user provided feature.
Data sources
To perform these analyses, we’ll need data on where food sources exist and whether these sources are considered healthy or unhealthy. We’ll also need data on campus locations, and then we’ll need a geoprocessing workflow that allows us to locate the number of each time of food source occurring within a set distance of each campus.
-
Campus locations. The Homeland Infrastructure Foundation-Level Data (HIFLD) open data site provides access to shapefile of all US college and university campuses: https://hifld-geoplatform.hub.arcgis.com/datasets/geoplatform::colleges-and-universities-campuses/about
-
Food source locations: I have compiled a set of food source locations tagged as healthy and unhealthy for the purposes of this exercise. This dataset is hosted on ArcGIS online via this link.
These data ultimately come from an Infogroup dataset on historical market trend and business data available to the Duke community via the Wharton Research Data Services (WRDS). Each business location in this dataset is tagged with a NAICS code identifying its business type. I selected records with a NAICS code starting with “445” located in North Carolina. I then joined a column tagging each category as “healthy”, “unhealthy”, or “unknown” based on my personal judgement.
Assignment
The set of tasks below are set to guide you through the process of completing our analysis. They roughly mimic the steps we took in developing our hurricane tracking analyses but with some key differences. Though you may know of different approaches to some of the tasks listed below, please adhere to the steps below so I can check that you properly apply the concepts taught.
✅Task 1: Prepare your workspace
- Create a new project folder called
ENV859_PS1_<netID>(replacing<netID>with your Duke NetID). - Add subfolders:
Data,Docs,Scratch,Scripts. - Add
readme.txtfile and include relevant information in it. - Create a new ArcGIS Pro project called
Food_mapper(and toolbox and default geodatabase) in your project folder. - Add a scratch geodatabase in the appropriate location.
- Set any relevant environmental variables.
✅Task 2: Gather and tidy your data sources
- Download and unpack this shapefile of college and university campuses from the HIFLD open data platform to your workspace and add to your project.
- Download and unpack the dataset of food source locations located on this link to your workspace and add to your project. (You may be asked to log into your ArcGIS Online account…)
- Explore your datasets; rename layers and symbolize them clearly.
✅Task 3: Develop the base workflow and model
Here, we’ll build a base geoprocessing model. We’ll later modify this base model, but for now, name this model: Food Mapping Tool. Include the analyses below in this model and be sure to tidy it up as we did in Step 2A of the Hurricane Class exercise.
![]() Set the model to run independently of whether the input datasets are listed in your map’s table of contents.
Set the model to run independently of whether the input datasets are listed in your map’s table of contents.
-
Selects a single campus - we’ll use “Duke University” - from the HIFLD campus feature class and writes the result to a new feature class file in your scratch geodatabase.
-
Selects all food source locations occurring within 1.5 km of this selected campus feature. (This should be done with a single tool; the
buffertool should not be needed!) For this exercise, do use planar, not geodesic distance in your tools. -
Writes the selected food source sites to a new feature class called “
FoodSitesNearCampus” in the project’s default geodatabase (just as we did affected counties in the hurricane example…). This tool’s product should be added to your map on completion. -
Be sure the processes in your tool reference data sources, not the layers in your map’s table of contents.
► Run the model. As a check, you should see 78 total food sources within 1.5km of Duke’s campus.
-
Tidy this workspace and archive it as a zip file tagged as “…
_version1.zip“ (as we did in the hurricane example).
✅Task 4. Construct a tool from your base model
In this step, we’ll tweak our base model so that it can be run like other geoprocessing tools, allowing the user to set values at run time and produce a standardize, symbolized output. Ultimately, we want our tool to identify food sources located within a user specified distance of a selected campus feature. The steps below guide you to that end.
-
Begin by making a copy of your
Food Mapping Toolmodel, naming the copy “Food Mapping Tool (v2. Task 4)”. Rename the original tool “Food Mapping Tool (v1. Base Model)” - First, add a variable to your model and set it to be an input parameter, allowing the user to select, at run time, which campus to examine.
- Name this parameter so that it appears as “
Campus” in the tool’s dialog. - Set
DUKE UNIVERSITYas its default value. - Allow the user to select from the following 4 campuses when running the model:
DUKE UNIVERSITY,
NORTH CAROLINA CENTRAL UNIVERSITY,
SHAW UNIVERSITY, and
UNIVERSITY OF NORTH CAROLINA AT CHAPEL HILL, in that order.
- Name this parameter so that it appears as “
- Enable a second model parameter that allows the user to specify the search distance (value and units) used to locate food source features near the selected campus features.
- Name this parameter such that it appears as “
Search Distance” in the tool’s dialog. - Set the default to 1.5 km.
- Ensure that this parameter is marked as “Required” (not “Optional”) in the tool’s interface.
- Name this parameter such that it appears as “
-
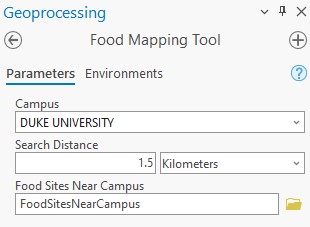
Allow the user to alter the output feature class name, with the default remaining as
FoodSitesNearCampuslocated in the project’s default geodatabase. (Name this parameter whatever you’d like in your model.) -
Set your model such that the output feature class is automatically added to the map and that the layer produced shows “favorable” sites appear as blue dots, “unfavorable” sites appear as red dots, and “unknown” appear as gray dots.
In the end, your tool dialog should resemble this figure:
- Run your tool to ensure it works. You should find there are 37 food sites within 1 km of Shaw University.
✅Task 5. Control execution in your tool
We now want to alter a copy of our previous model (the one created in step 4) so that it allows the user to continue to write all food sources or just unfavorable ones in the output via a Boolean check box input. Name this tool “Food Mapping Tool (v3. Task 5)”
-
Add a new Boolean variable and set it to be a parameter named “
Unfavorable only?” .-
Set the default value to be “False” (unchecked).
-
Make what additional changes are needed in your model such that if the Boolean variable is set to true, the output includes only unfavorable points, saved as “
NearbyUnfavorableFoodSources” in the project’s default geodatabase. Otherwise, the default output of “FoodSitesNearCampus” is saved, as in the previous version of your model.
Hint: This is quite similar step taken in modeling hurricanes here
-
-
Ensure that the output (either all food sites, or just the unfavorable ones) is added to the display when the model is run, whether the user selects the Boolean checkbox or not.
-
For full credit, ensure that the unfavorable sites are appear as red dots.
✅Task 6. Add iteration to your workflow
Here, we want to explore food sites at various distances from a selected campus. We’ll do this by adding an iterator to our tool to iterate through a set of distances, in km, set by the user. ![]() To simplify things, we’ll build off of our “v2. Task 4” model, leaving out the option to process just unfavorable sites or all sites.
To simplify things, we’ll build off of our “v2. Task 4” model, leaving out the option to process just unfavorable sites or all sites.
-
Make a copy of your
Food Mapping Tool (v2. Task 4), naming the copyFood Mapping Tool (v4. Task 6). -
Remove the existing ‘Search Distance’ variable from your model. (We’ll be replacing this with the output of our iterator…)
-
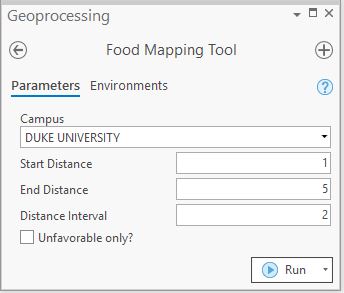
Add “For” iterator to your model setting it to iterate from 2 to 6 in increments of 2.
 Rename the output of the For iterator from “Value” to “Distance”. (This is important in the next step!)
Converting integers into linear units using the Calculate Value tool
The For iterator created above iterates through three values: 2, 4, and 6. We want to convert these integer values into linear units: 2, 4, and 6 kilometers. In order to do this, we need a way to alter data types; otherwise these values won’t be read correctly in any tool expecting distance values in anything but decimal degrees (the default). This process is a bit tricky, and so I’ve provided instructions below and a video on how it’s done:
-
From the Utilities dropdown menu (when the Model Builder menu is active), add the Calculate Value tool to your model.
-
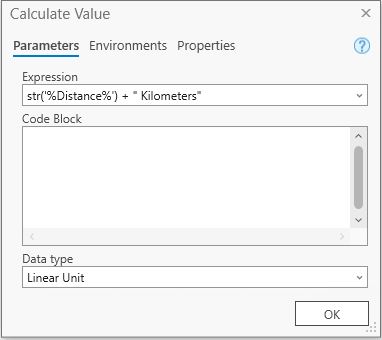
Open the Calculate Value tool, and set it’s expression to (be sure to include the space before
Kilometers!):
str('%Distance%') + " Kilometers"
(“Distance” here refers to the output of your For iterator, which is why we renamed it…) -
Leave the Code Block section blank.
-
Set the Data Type to be “Linear Unit”.
-
-
Rename the output produced by the Calculate Value tool above to
Search Distanceso that it will be used to set the distance from which food source locations near a given campus are selected. -
Make the iteration output (i.e. “
Distance”) a precondition of theCalculate Valuetool. This ensures that the Calculate Values always runs after the iterator changes, not before. -
Include the “Distance” value produced by the iterator in the output filename, setting the outputs to go to the project’s default geodatabase, e.g. “
Sites_3km_from_campus”. -
Add/set parameters in your model to allow the user to set the start, end, and interval distances for the iterator when run.
-
Ensure that all outputs are added to your map when the model is run to completion. (Recall that you will need to add the “Collect Values” tool to your model to enable output to be displayed!)
![]() Tip: As you are debugging your tool, it may be helpful to delete any feature classes created from previous iterations of your model runs. And don’t forget to validate your model to reset any iterators if you are running it in “edit” mode.
Tip: As you are debugging your tool, it may be helpful to delete any feature classes created from previous iterations of your model runs. And don’t forget to validate your model to reset any iterators if you are running it in “edit” mode.
Challenge!
Challenges are not worth as much as other questions, so give it a try, but don’t worry if you don’t get it or abort because you are spending too much time on it…
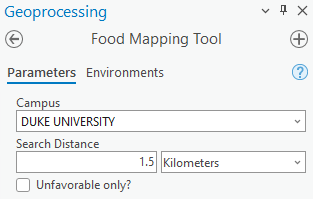
Enable your model so that the user has the option to select unfavorable, or all food sites in the output generated. In the end, your tool interface should appear similar to this:
All outputs should be added to the map when complete, and each output should have proper symbology.
Name this tool “
Food Mapping Tool (v4a. Challenge)”.
✅Task 7. Enable user interaction
Devise a new geoprocessing model that allows the user to draw a point, line, or polygon, enter a distance (in miles), and extract food source locations within that distance of the user’s drawn feature. Use your best judgment on the design and execution of this model and on which existing model you might want to start your work from (or start from scratch).
Save a versioned copy of this tool as “Food Mapping Tool (v5. Task 7)”
✅Task 8. Document and distribute your tool
Finally, we want to package and distribute our tool as both a geoprocessing package and a tidy, compressed workspace. We’ll chose the “Flow Control” tool as the one we want to share.
- Create a copy of your
Food Mapping Tool (v3. Task 5)model and title it “Food source extraction tool”. - Document your tool via its metadata, adding your NetID as one of the model’s metadata tags.
- Ensure that this tool is completely tidy: elements are named properly and any extraneous items have been removed.
- Zip the entire workspace. Ensure that your netID is found in the zip filename, and submit this workspace to Sakai.
💡Thought for later discussion…
While not a graded part of this assignment, consider how you might use the concepts and tools learned here to iterate through all campus polygons, extract food sources within a set distance of each and tally the number of “favorable” vs “unfavorable” sites. And then what additional analyses you might engage to further differentiate these results between HBCU and PWI institutions, and how you might visualize those results to shed light on whether one set has significantly different food options available…
While this can all be done via the model builder and ArcGIS Pro, perhaps you now see that it’s quite cumbersome. Perhaps you are finding we are hitting a ceiling with what we can do with the model builder.
Also, consider what biases this analysis might have with respect to the data used and assumptions made.
We will discuss all these issues as we transition to the next stage in our course where we learn Python coding as an alternative to the geoprocessing modeler.