Adv. Geoprocessing 4 - User Interactivity
Introduction
With variables and parameters, we allow the user some control over the inputs to our processes, but these are only tabular inputs. What if we wanted to allow the user to interact with the map itself - for example, draw the storm track line manually as opposed to build one from a queried set of points?
To do this, we add a special type of variable to our model - something called a “Feature Set”. This variable allows your tools to be graphically interactive: the user can draw a point, line, or polygon as the input to a process. For example, instead of using a hurricane track generated from point data, the user can draw his or her own track to run the model!
This short exercise demonstrates how a Feature Set is implemented in your tool. Here, we’ll tweak our original hurricane model workflow to allow the user extract counties intersecting a hurricane track he or she draws.
Enable user interactivity with a Feature Set variable 
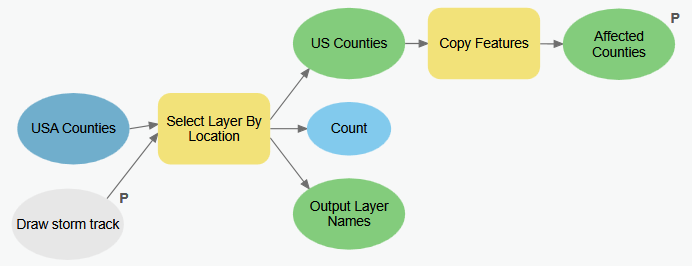
- Make a copy of your original
Hurricane Trackermodel, naming it something likeHurricane Tracker - User Input. - Edit this model, removing all components that lead up to the Select Layer By Location process - but keep the USA Counties element in the model.
- Add a new Feature Set variable to the model, rename it something (e.g. “Draw Storm Track”), and set it as a model parameter.
- Set this feature set as the Selecting Features for the Select Layer By Location process.
- Ensure that the Affected Counties output is also set as a parameter.
- Reorder your model parameters so that the Feature Set variable is first, if necessary.
- Make your map the active document then run your model, using the Pencil icon to draw a polyline on the map.
Recap
» A workspace completed to this step is available here: HurricaneMapper_Version4.zip
We now have a tool that allows users to interaction spatially with our map and use that as an input to our model.